
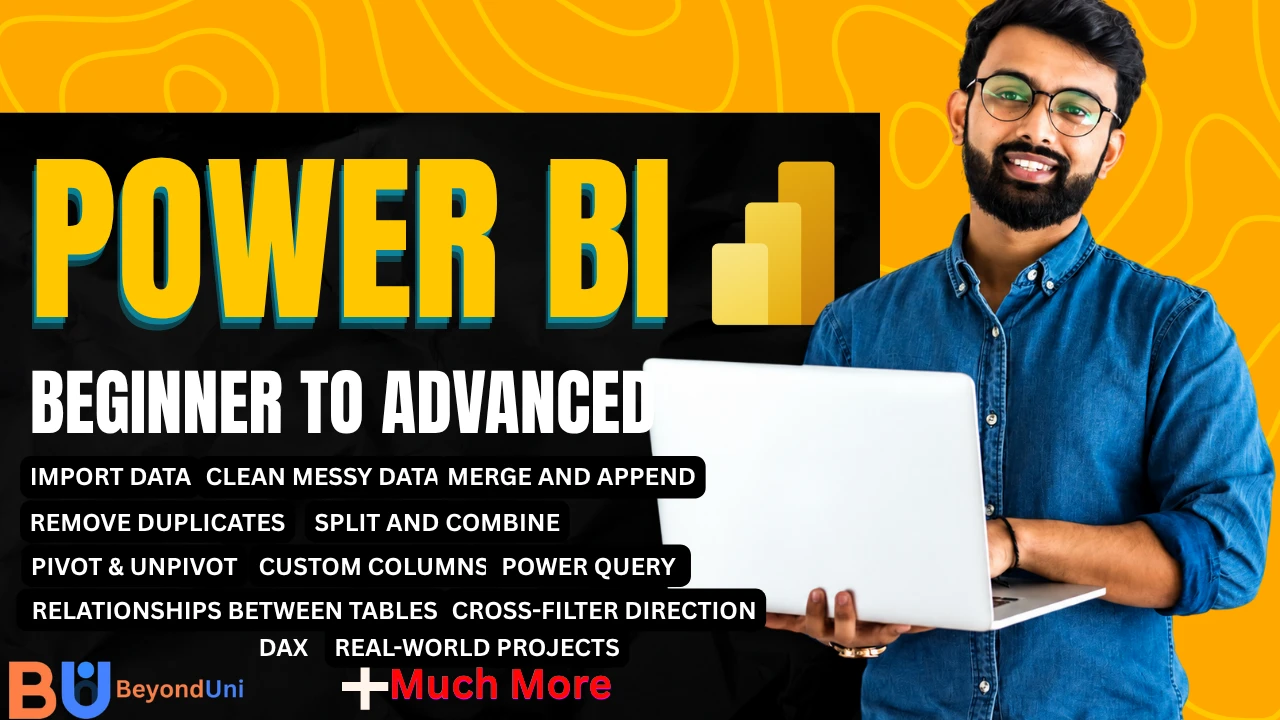
About Course
Learn Microsoft Power BI from scratch and become proficient in transforming raw data into interactive dashboards and insightful reports. This comprehensive course is designed for beginners as well as professionals looking to enhance their data analytics and business intelligence skills.
Throughout this course, you’ll work with real-world datasets and learn how to create visually appealing, interactive dashboards that help businesses make data-driven decisions. By the end of the course, you’ll have the confidence to build professional reports and analyze business data effectively.
What You’ll Learn
-
Introduction to Business Intelligence & Power BI
-
Installing and Navigating Power BI Desktop
-
Importing Data from Excel, CSV, SQL & Other Sources
-
Data Cleaning & Transformation with Power Query
-
Data Modeling & Table Relationships
-
DAX (Data Analysis Expressions)
-
Calculated Columns & Measures
-
Time Intelligence Functions
-
Logical Functions & Conditional Calculations
-
Interactive Charts & Visualizations
-
KPIs, Cards, Tables & Matrix Visuals
-
Slicers, Filters & Drill-Through Reports
-
Bookmarks & Dashboard Navigation
-
Creating Professional Dashboards
-
Report Optimization & Best Practices
-
Publishing Reports to Power BI Service
-
Sharing & Collaborating on Reports
-
Row-Level Security (RLS)
-
Real-World Business Projects
-
Interview Preparation & Industry Best Practices
Who This Course Is For
-
Students
-
Data Analysts
-
Business Analysts
-
Finance Professionals
-
MIS Executives
-
Working Professionals
-
Business Owners
-
Anyone interested in Data Analytics and Business Intelligence
By the end of this course, you’ll be able to confidently create professional Power BI dashboards, automate reporting, analyze complex datasets, and generate actionable business insights that drive better decision-making.