
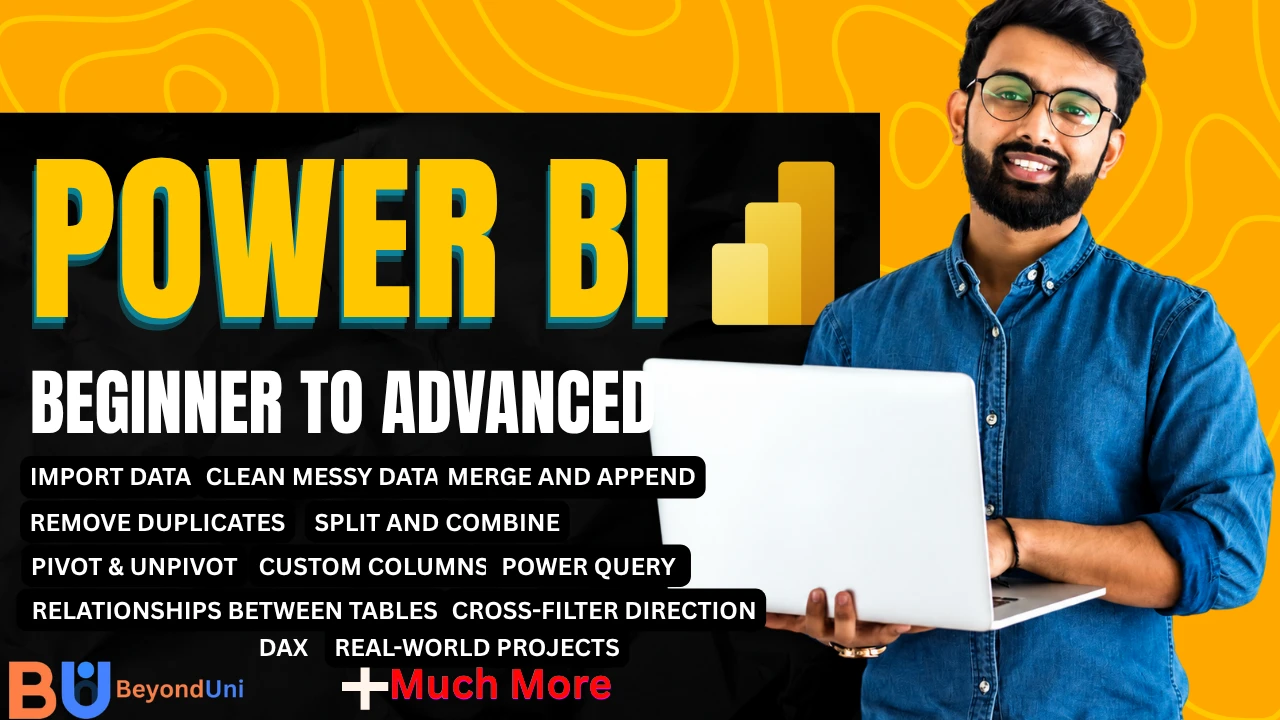
Master Microsoft Power BI and learn how to transform raw data into interactive dashboards and professional business reports. This course is designed for beginners, students, working professionals, business owners, and anyone looking to build practical business intelligence and data visualization skills. Start with the fundamentals of Power BI, including data import, cleaning, transformation, and data modeling. As you progress, you’ll learn DAX, interactive visualizations, dashboard creation, report optimization, and best practices used by industry professionals. Through step-by-step lessons, practical exercises, and real-world projects, you’ll gain the confidence to build powerful dashboards, analyze business data, and generate actionable insights. You’ll also discover more professional courses and resources available at BeyondUni to continue building your data analytics and business intelligence skills.
- (+91) 8287983018
- Contact@beyonduni.in